qrisp.qaoa.QAOABenchmark.visualize#
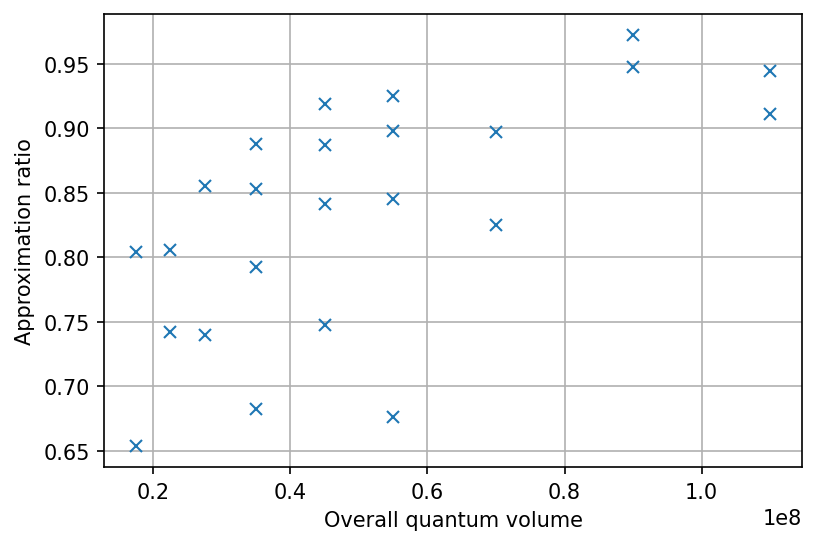
- QAOABenchmark.visualize(cost_metric='oqv', gain_metric='approx_ratio')[source]#
Plots the results of
.evaluate.- Parameters:
- cost_metricstr or callable, optional
The method to evaluate the cost of each run. The default is “oqv”.
- gain_metricstr or callable, optional
The method to evaluate the gain of each run. The default is “approx_ratio”.
Examples
We create a MaxCut instance and benchmark several parameters
from qrisp import *
from networkx import Graph
G = Graph()

G.add_edges_from([[0,3],[0,4],[1,3],[1,4],[2,3],[2,4]])

from qrisp.qaoa import maxcut_problem

max_cut_instance = maxcut_problem(G)

benchmark_data = max_cut_instance.benchmark(qarg = QuantumVariable(5),
                           depth_range = [3,4,5],
                           shot_range = [5000, 10000],
                           iter_range = [25, 50],
                           optimal_solution = "11100",
                           repetitions = 2
                           )
To visualize the results, we call the corresponding method.
benchmark_data.visualize()