qrisp.qaoa.QAOAProblem.benchmark#
- QAOAProblem.benchmark(qarg, depth_range, shot_range, iter_range, optimal_solution, repetitions=1, mes_kwargs={}, init_type='random', optimizer='COBYLA', options={})[source]#
This method enables convenient data collection regarding performance of the implementation.
- Parameters:
- qargQuantumVariable or QuantumArray or callable
The argument to which the QAOA circuit is applied, or a function returning a QuantumVariable or QuantumArray to which the QAOA circuit is applied. Compare to the
.runmethod.- depth_rangelist[int]
A list of integers indicating, which depth parameters should be explored. Depth means the amount of QAOA layers.
- shot_rangelist[int]
A list of integers indicating, which shots parameters should be explored. Shots means the amount of repetitions, the backend performs per iteration.
- iter_rangelist[int]
A list of integers indicating, what iterations parameter should be explored. Iterations means the amount of backend calls, the optimizer is allowed to do.
- optimal_solution-
The optimal solution to the problem. Should have the same type as the keys of the result of
qarg.get_measurement().- repetitionsint, optional
The amount of repetitions, each parameter constellation should go though. Can be used to get a better statistical significance. The default is 1.
- mes_kwargsdict, optional
The keyword arguments, that are used for the
qarg.get_measurement. The default is {}.- init_typestring, optional
Specifies the way the initial optimization parameters are chosen. Available are
randomandtqa. The default israndom: The parameters are initialized uniformly at random in the interval \([0,\pi/2]\). Fortqa, the parameters are chosen based on the Trotterized Quantum Annealing protocol. Iftqais chosen, and noinit_functionfor the QAOAProblem is specified, the \(\ket{-}^n\) state is prepared (the ground state for the X mixer).- optimizerstr, optional
Specifies the SciPy optimization routine. Available are, e.g.,
COBYLA,COBYQA,Nelder-Mead. The Default isCOBYLA.- optionsdict
A dictionary of solver options.
- Returns:
- QAOABenchmark
The results of the benchmark.
Examples
We create a MaxCut instance and benchmark several parameters
from qrisp import *
from networkx import Graph
G = Graph()

G.add_edges_from([[0,3],[0,4],[1,3],[1,4],[2,3],[2,4]])

from qrisp.qaoa import maxcut_problem

max_cut_instance = maxcut_problem(G)

benchmark_data = max_cut_instance.benchmark(QuantumVariable(5),
                           depth_range = [3,4,5],
                           shot_range = [5000, 10000],
                           iter_range = [25, 50],
                           optimal_solution = "11100",
                           repetitions = 2
                           )
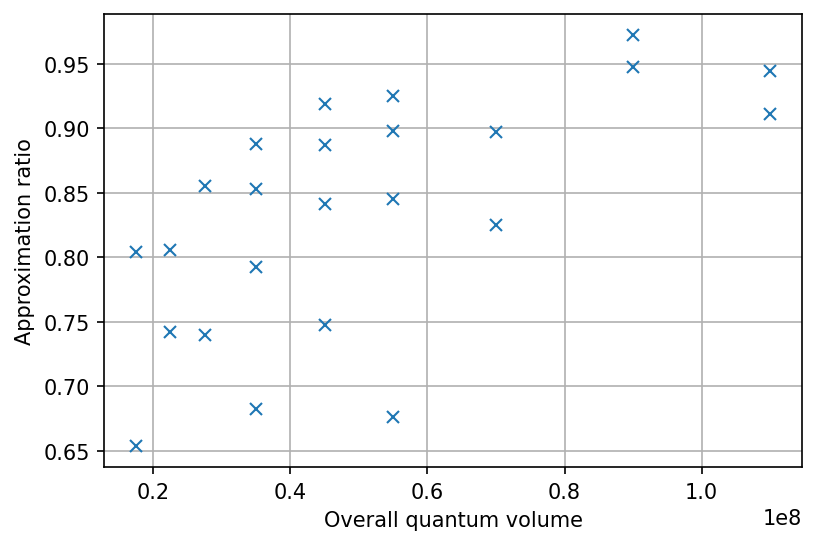
We can investigate the data by calling
visualize:benchmark_data.visualize()
The QAOABenchmark class contains a variety of methods to help you drawing conclusions from the collected data. Make sure to check them out!